How to Use Chrome DevTools
I’ve been using DevTools for a while, but I often feel like I don’t really know how to use all the tools. Or even all the tools that actually exist (there’s a lot)!
Everything here is something I use already or wish I’d known about sooner. It’s mostly organized by what you’re trying to do, not by which panel it’s in.
Getting Around
Command Menu. Cmd + Shift + P opens it. It works like the VS Code command palette. Type what you want to do and it’ll find it.
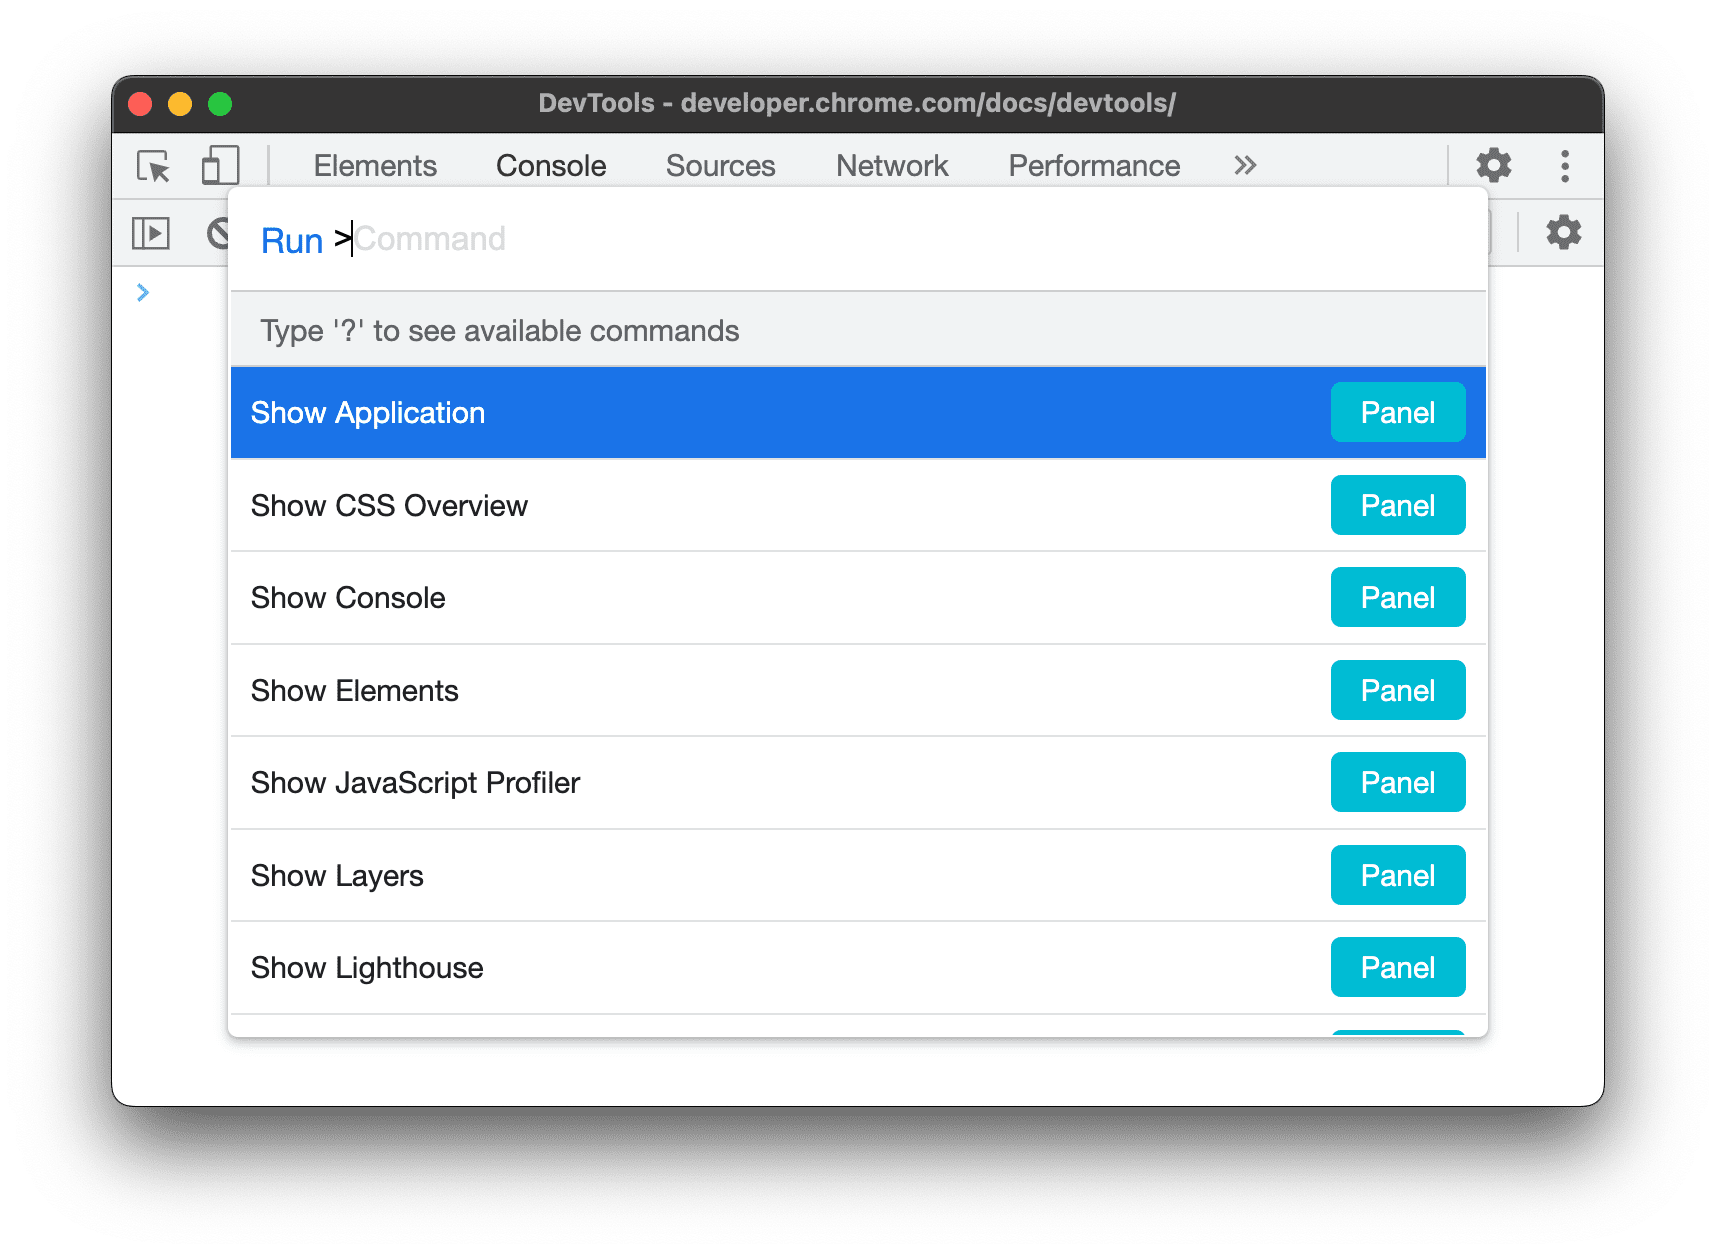
Cmd + Shift + P to open.Quick open. Cmd + P opens any file loaded by the page. If you know the filename you’re looking for, this is faster than navigating the Sources tree.
Switch panels. Cmd + ] and Cmd + [ move between panels. Cmd + Shift + J goes straight to Console. Cmd + Shift + C goes straight to element inspection mode.
Search across all files. Cmd + Option + F searches every file loaded by the page. Useful for finding where a string, class name, or function is defined when you don’t know which file it’s in.
Elements and CSS
Inspect. Cmd + Shift + C activates the selector, then click any element. Or right-click anything on the page and hit Inspect. You probably know this one.
Force element state. Select an element, click the :hov button in the Styles tab, and check :hover, :active, :focus, or :focus-within. The element stays in that state so you can inspect the styles without trying to keep your mouse in the right spot.
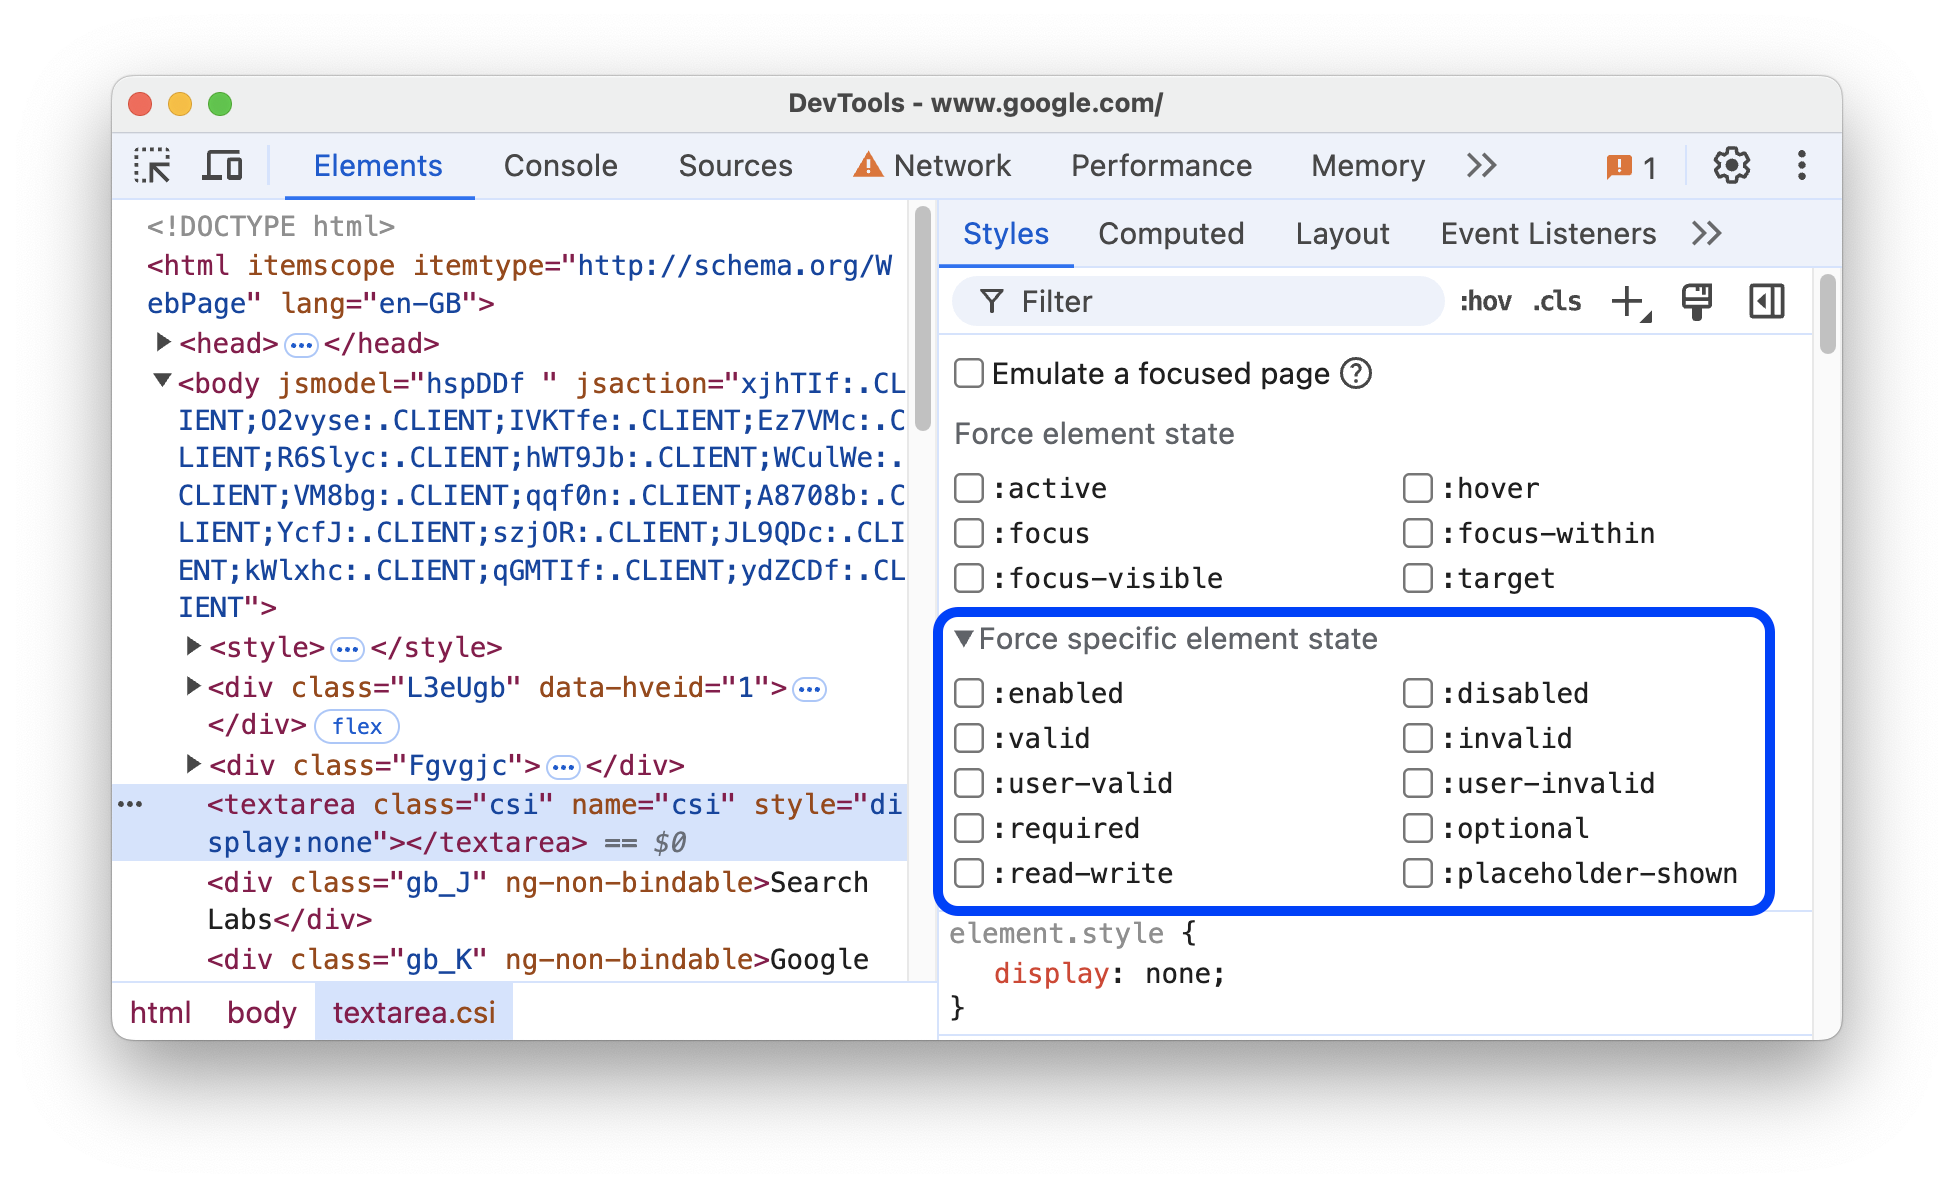
:hover, :active, :focus without holding the mouse.Edit HTML live. Double-click any element in the Elements panel to edit its HTML. You can change text, attributes, add elements, whatever. Changes show up immediately.
Edit CSS live. Click any CSS value in the Styles panel to change it. Click the property name to change that too. Add new properties by clicking the empty space at the bottom of a rule. Toggle any property on/off with the checkbox next to it.
Add a class. The .cls button in the Styles panel lets you add or remove CSS classes from the selected element. Faster than editing the class attribute by hand.
See computed styles. The Computed tab shows every CSS property actually applied to the element after cascade, inheritance, and specificity resolve. Click the arrow next to any property to jump to the rule that set it.
CSS specificity. Hover over a selector in the Styles tab to see its specificity score.
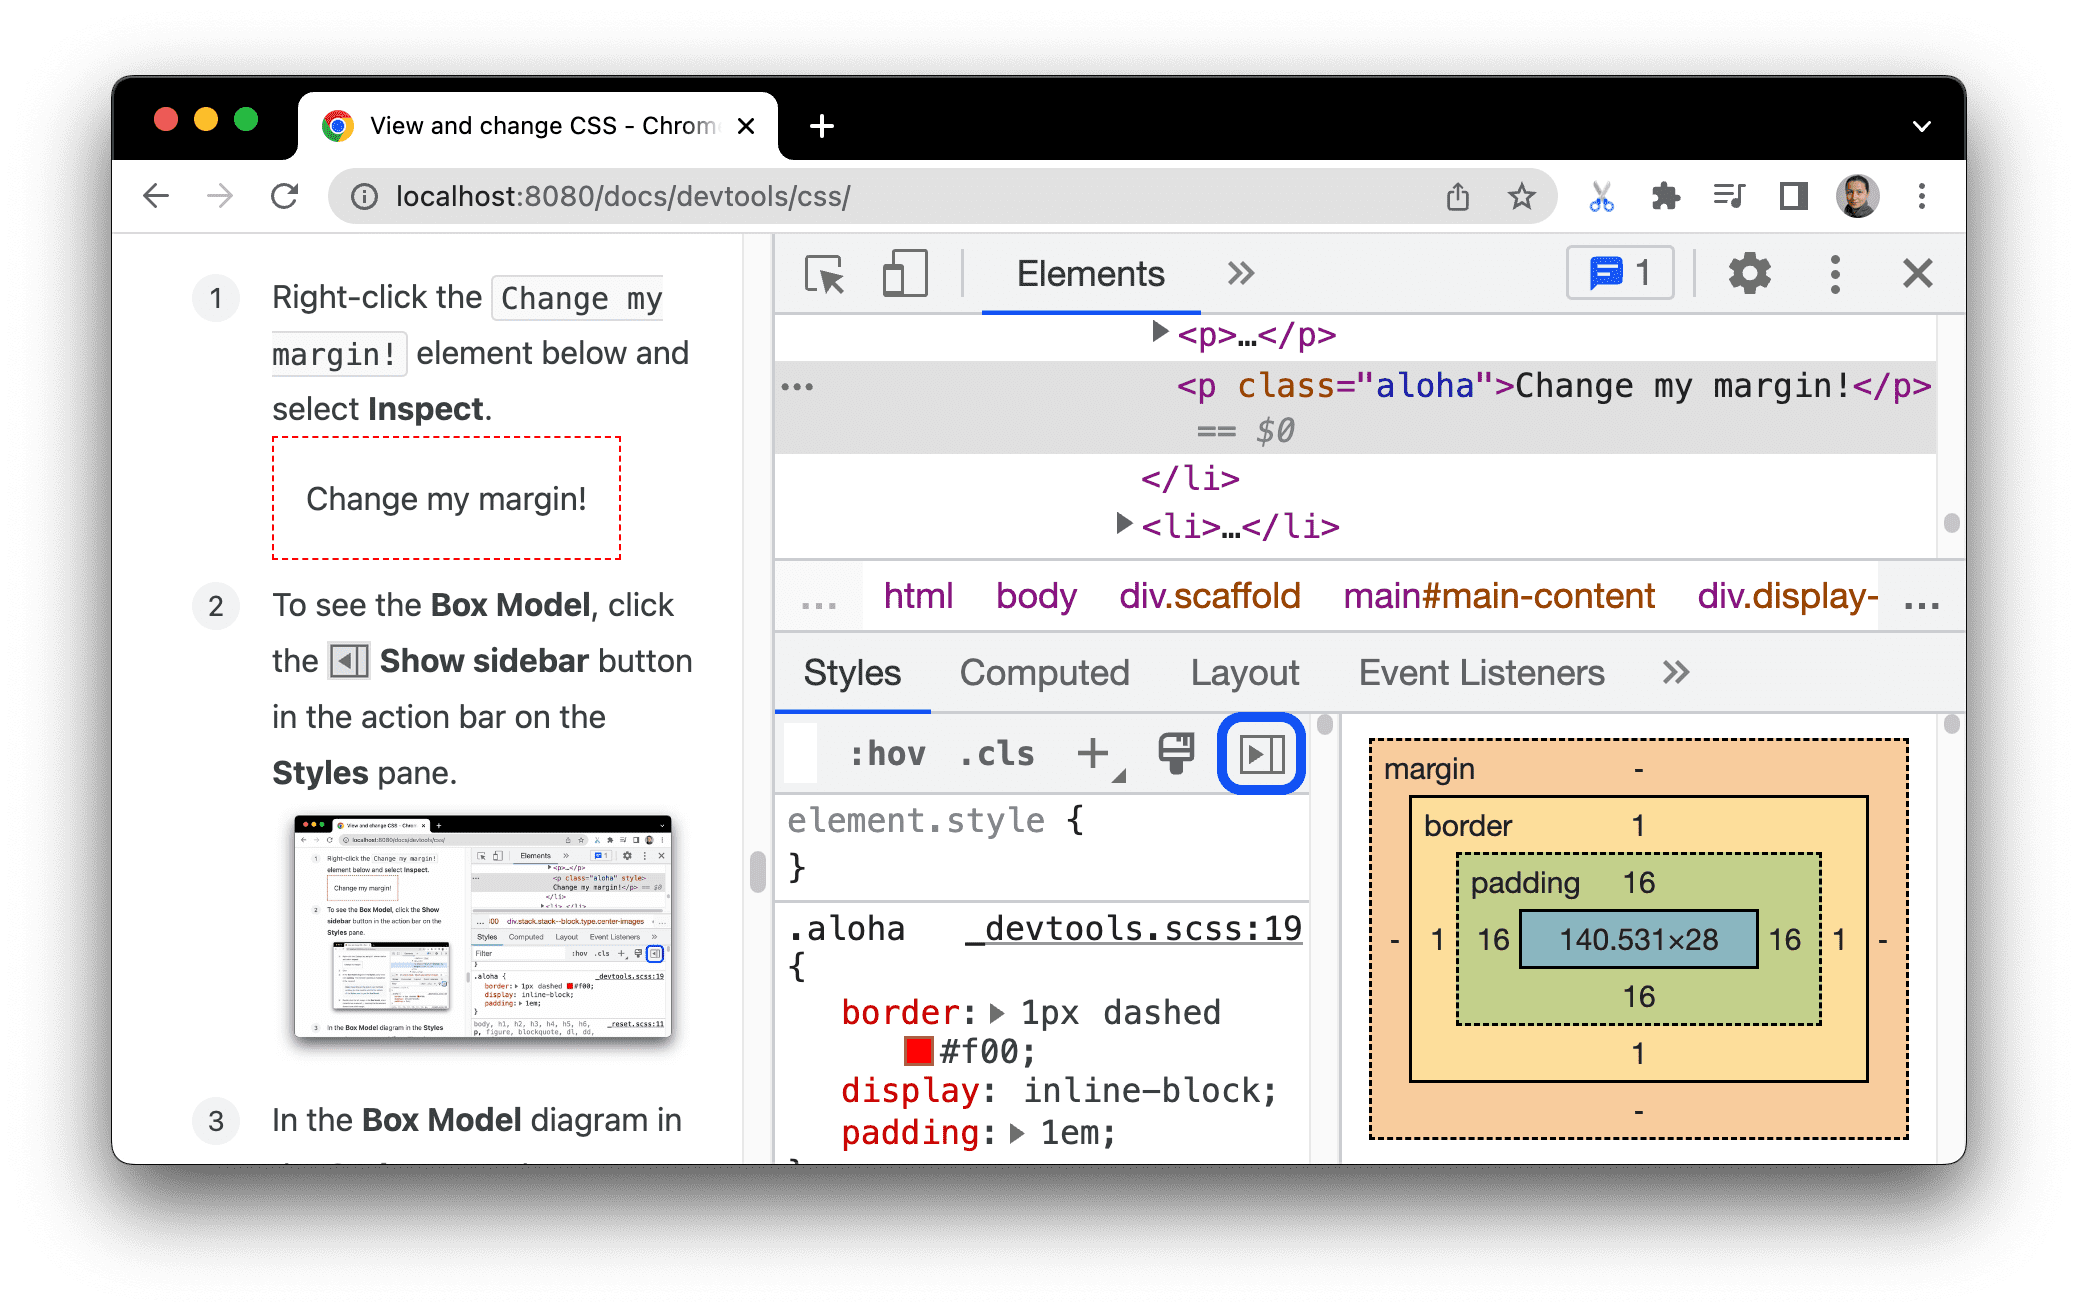
Box model. The box model diagram at the bottom of the Styles tab (or top of Computed) is interactive. Double-click any value to change margin, padding, border, or dimensions.
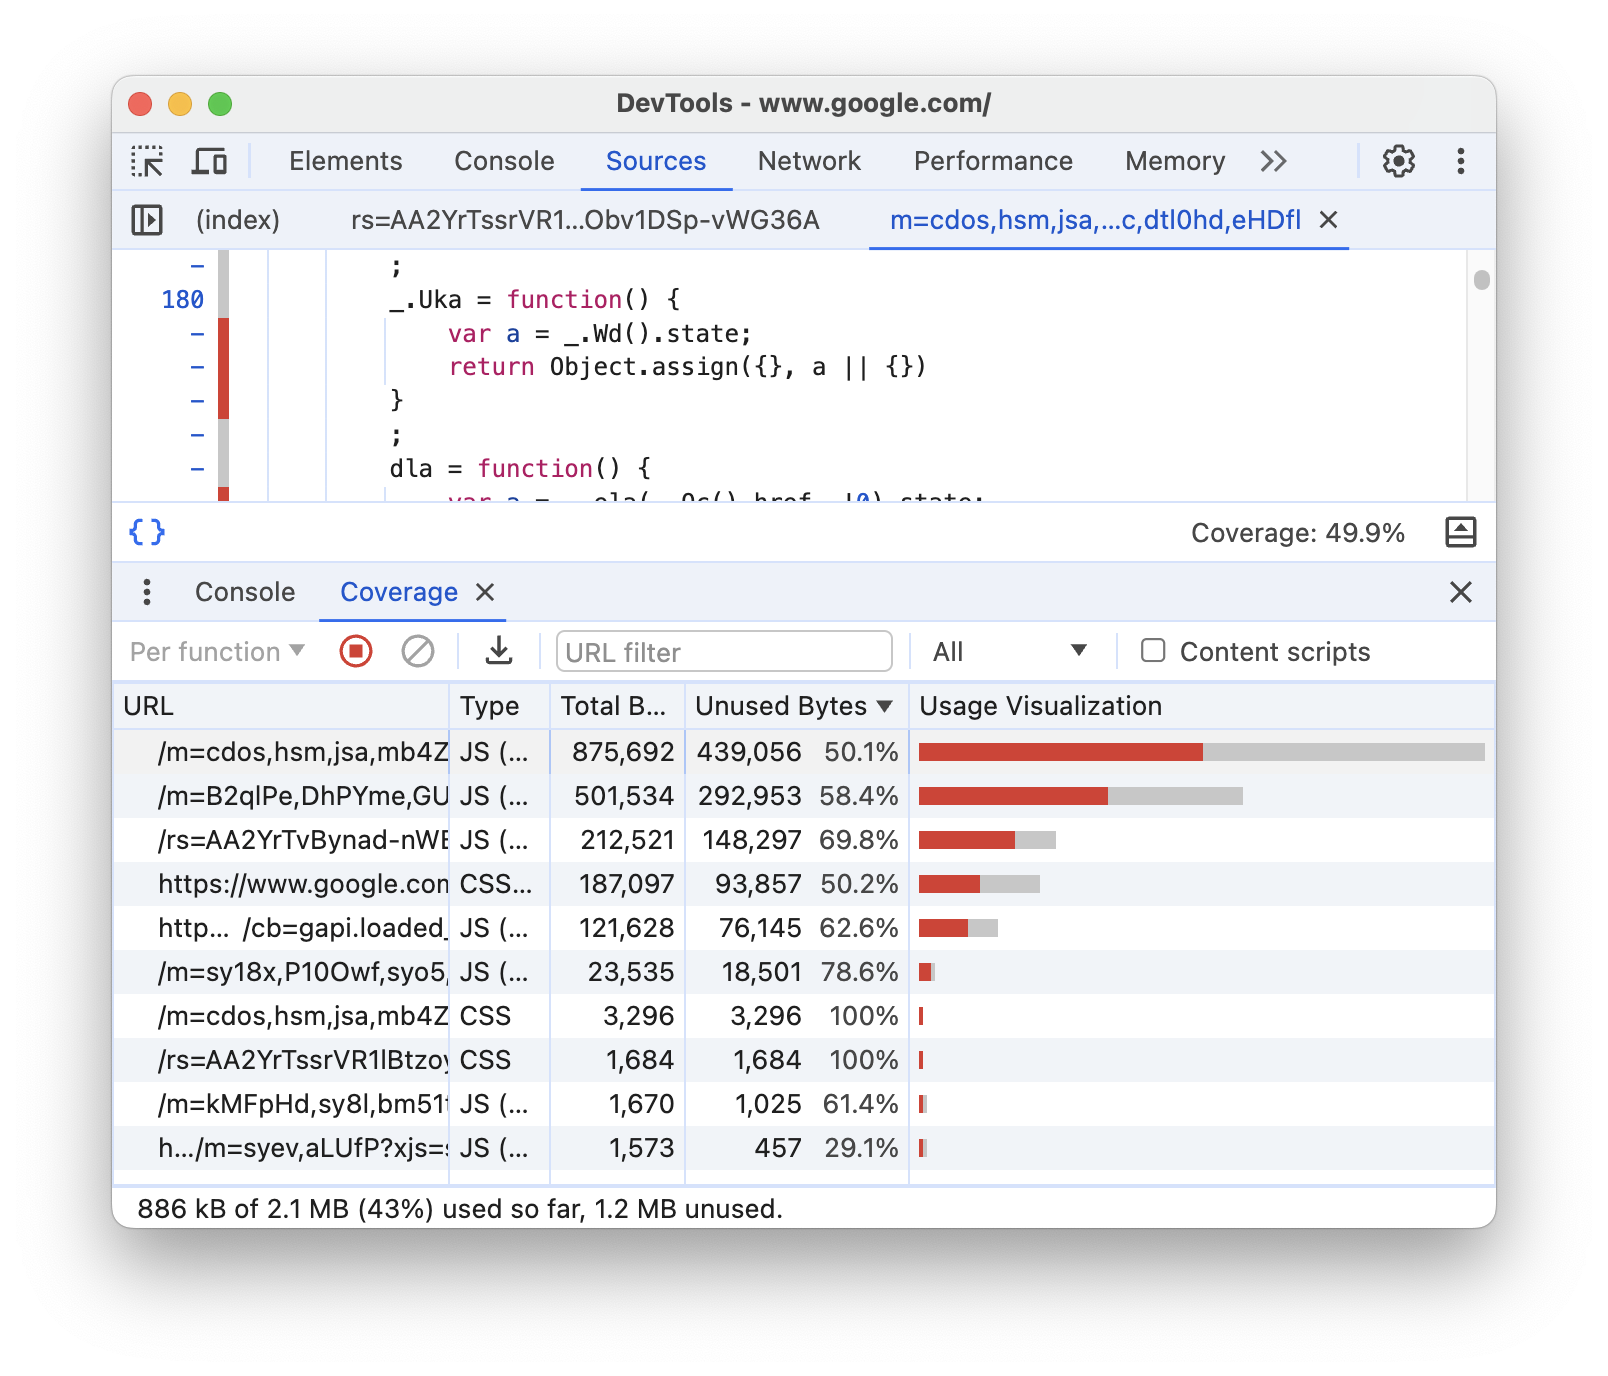
Find unused CSS. Cmd + Shift + P, type “Coverage”, click record, interact with the page. Red bars mean unused code, green means used. This tells you how much CSS (and JS) the page loads but never runs.
Colors. Click any color swatch in the Styles panel to get a visual color picker. You can switch between hex, rgb, and hsl.
Drag and reorder. You can drag elements in the DOM tree to reorder them. Useful for testing layout changes without editing code.
Console
$0 through $4. $0 in the console references whatever element you have selected in the Elements panel. $1 is the previously selected element, and so on. I use $0 constantly.
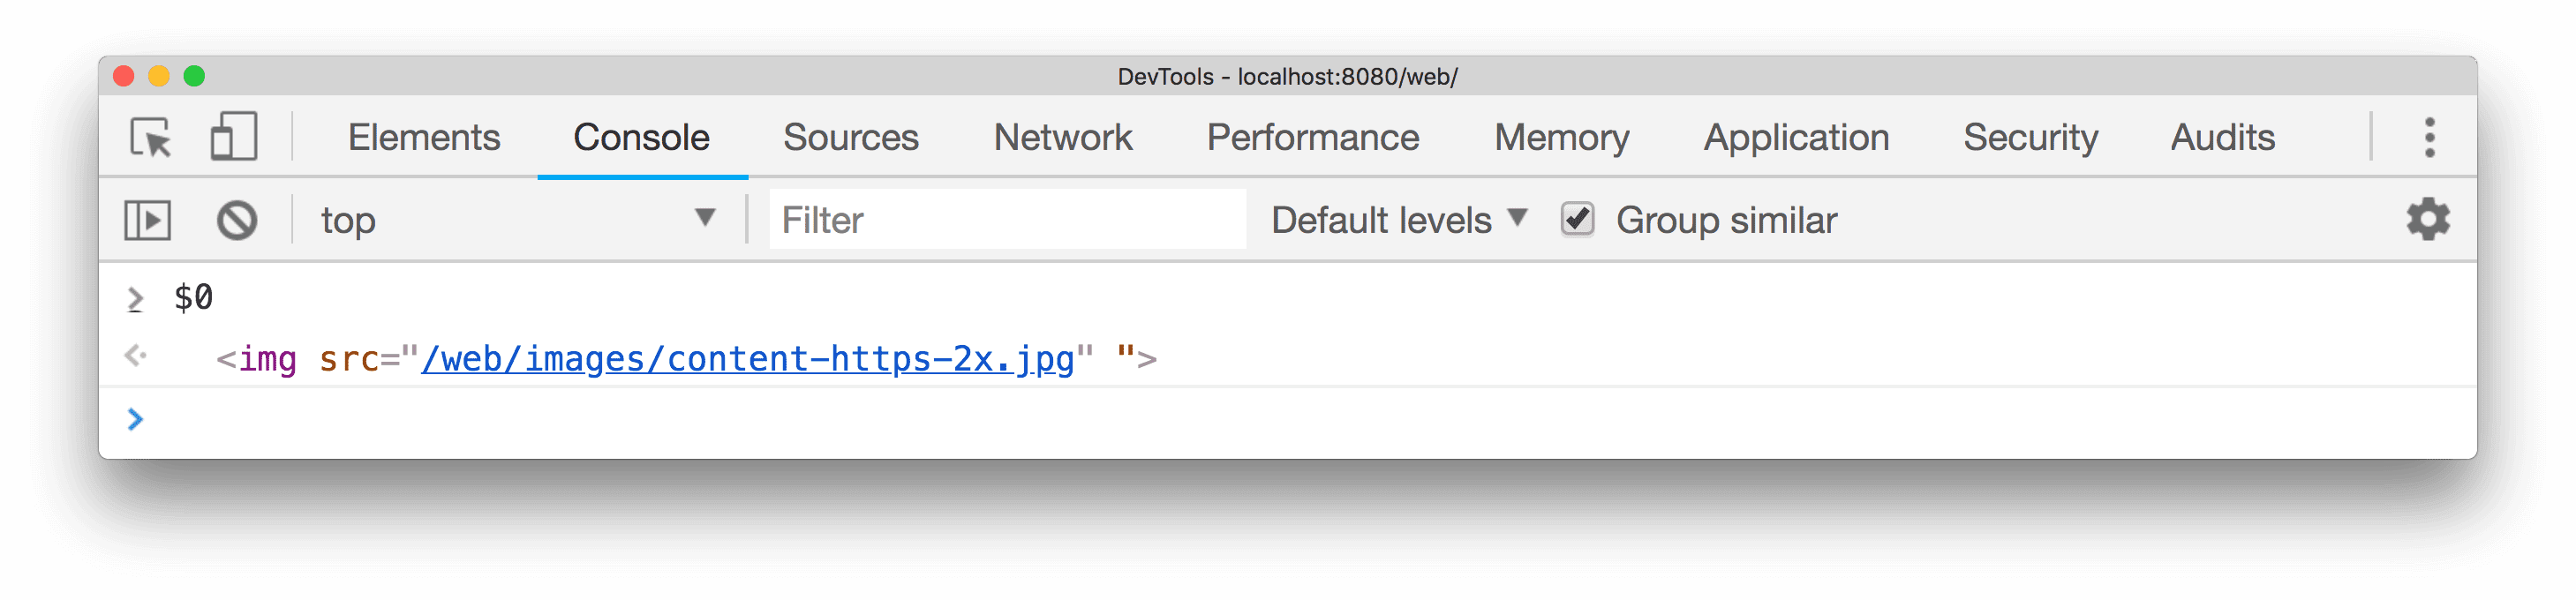
$0 references the currently selected element.$('selector') and $$('selector'). Shortcuts for document.querySelector and document.querySelectorAll. Only work in the console, not in page scripts.
console.table(). Pass it an array of objects and it renders a sortable table. Way more readable than logging an array.
console.time() / console.timeEnd(). Wrap code between console.time('label') and console.timeEnd('label') to measure how long it takes.
console.group() / console.groupEnd(). Creates collapsible groups in the console output. Useful for organizing noisy logging.
console.trace(). Logs a stack trace at whatever point you call it. Helpful for figuring out where a function is being called from.
monitor(fn). Logs every time a function is called, with its arguments. unmonitor(fn) to stop. Only works for functions in global scope.
Copy an object. copy(obj) copies any JavaScript object to your clipboard as JSON. This one is easy to forget about.
Filter messages. The filter bar at the top of the Console panel lets you filter by text, by level (errors, warnings, info), or by source. The “Selected context only” dropdown filters to the current iframe or worker.
Preserve log. Check “Preserve log” in Console settings to keep messages across page reloads. Invaluable when debugging redirect flows or page initialization.
Debugging JavaScript
Set a breakpoint. Sources panel, click a line number. The blue marker means execution will pause there. Click it again to remove it.
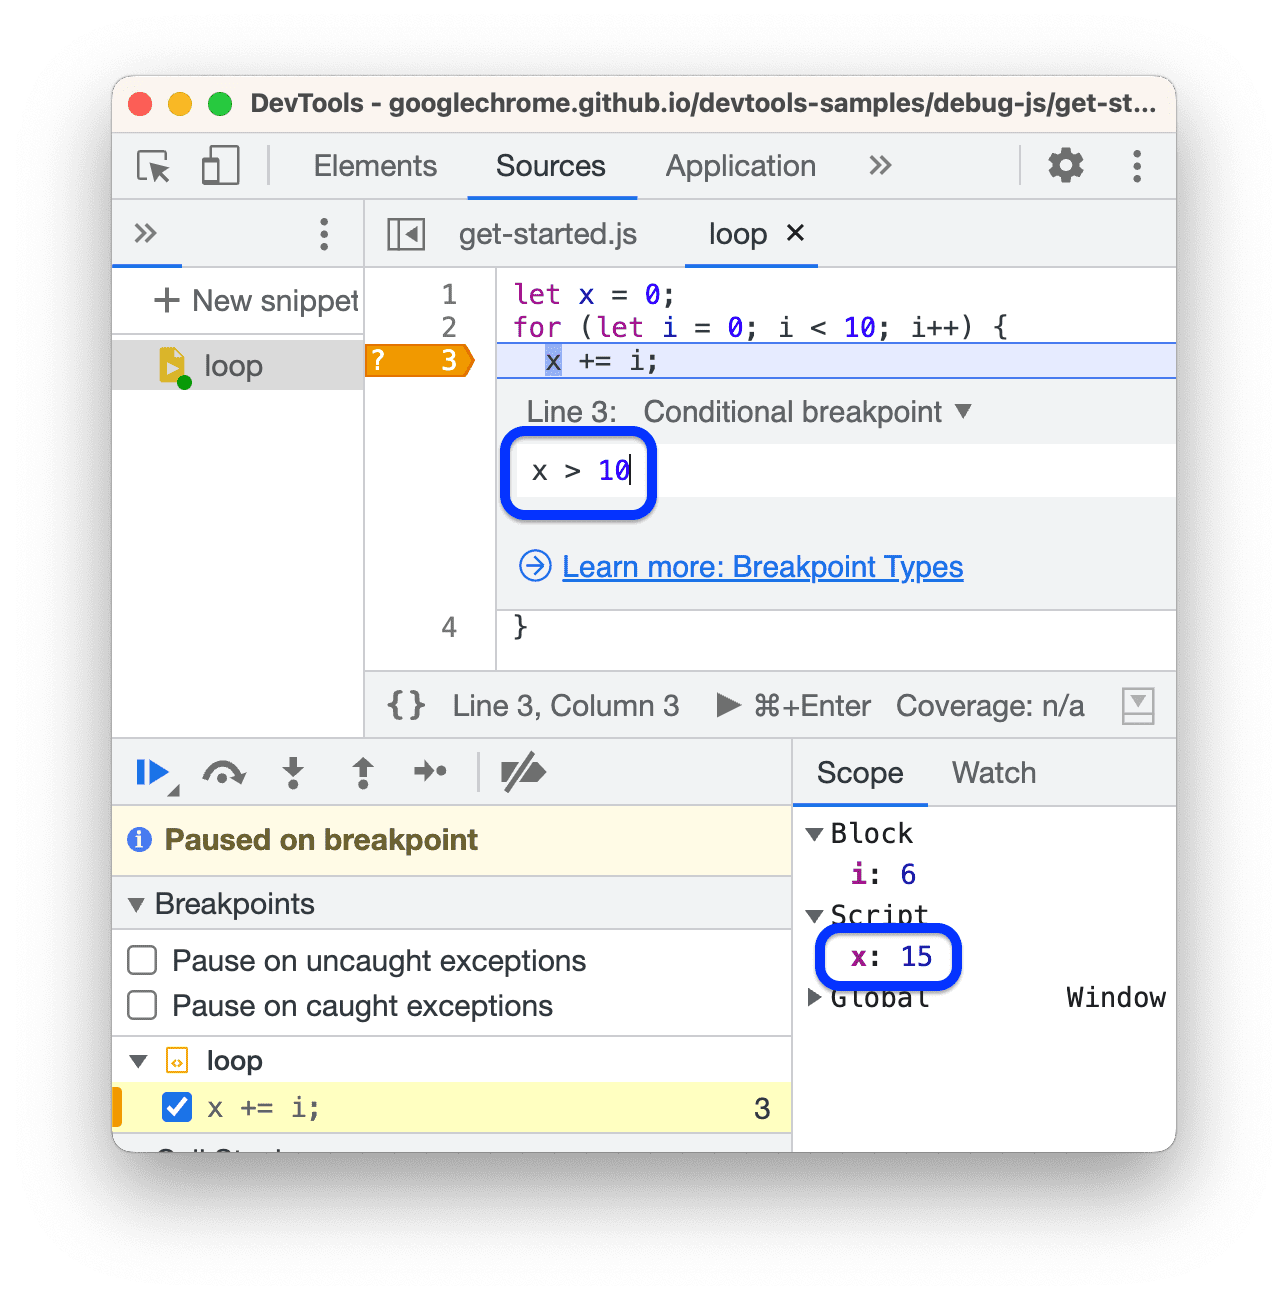
Conditional breakpoints. Right-click a line number, choose “Add conditional breakpoint,” enter a condition like x > 10. Execution only pauses when the condition is true. Saves you from stepping through irrelevant iterations.
Pause on exceptions. The pause icon in the Sources panel has a toggle for pausing on all exceptions or only uncaught ones. Useful for catching errors the moment they happen instead of hunting through the call stack.
Step through code. Once paused:
-
F10(step over) executes the current line and moves to the next -
F11(step into) enters the function being called -
Shift + F11(step out) runs to the end of the current function and pauses in the caller -
F8resumes execution
Watch expressions. In the Sources panel sidebar, add expressions to the Watch section. They update every time execution pauses. Useful for tracking a variable across multiple breakpoints.
Local variables. The Scope section in the Sources panel shows every variable in scope when execution is paused. Local, closure, and global scopes are all visible.
Pretty print. Click the {} icon at the bottom of any minified file to format it. Makes third-party code readable enough to set breakpoints in.
Blackbox scripts. Right-click a script in the Sources panel and choose “Add script to ignore list.” The debugger will skip over it when stepping. Useful for skipping framework internals.
Debug event listeners. Elements panel, select an element, expand the “Event Listeners” tab. Shows every listener attached, with a link to the handler source. Check “Ancestors” to see listeners on parent elements.
Network
See all requests. The Network panel logs every request the page makes. Each row shows method, status, type, size, and timing. Click any request for details.
Filter by type. The filter bar has buttons for XHR, JS, CSS, Img, Media, Font, Doc, WS, and more. Click one to show only that type.
Throttle network speed. The “No throttling” dropdown lets you simulate Slow 3G, Fast 3G, or custom speeds. Useful for testing how your site behaves on bad connections.
Simulate offline. Check the “Offline” checkbox next to the throttling dropdown. The page can’t make any network requests.
Disable cache. “Disable cache” checkbox at the top of the Network panel. Only active while DevTools is open. Forces fresh downloads of every resource.
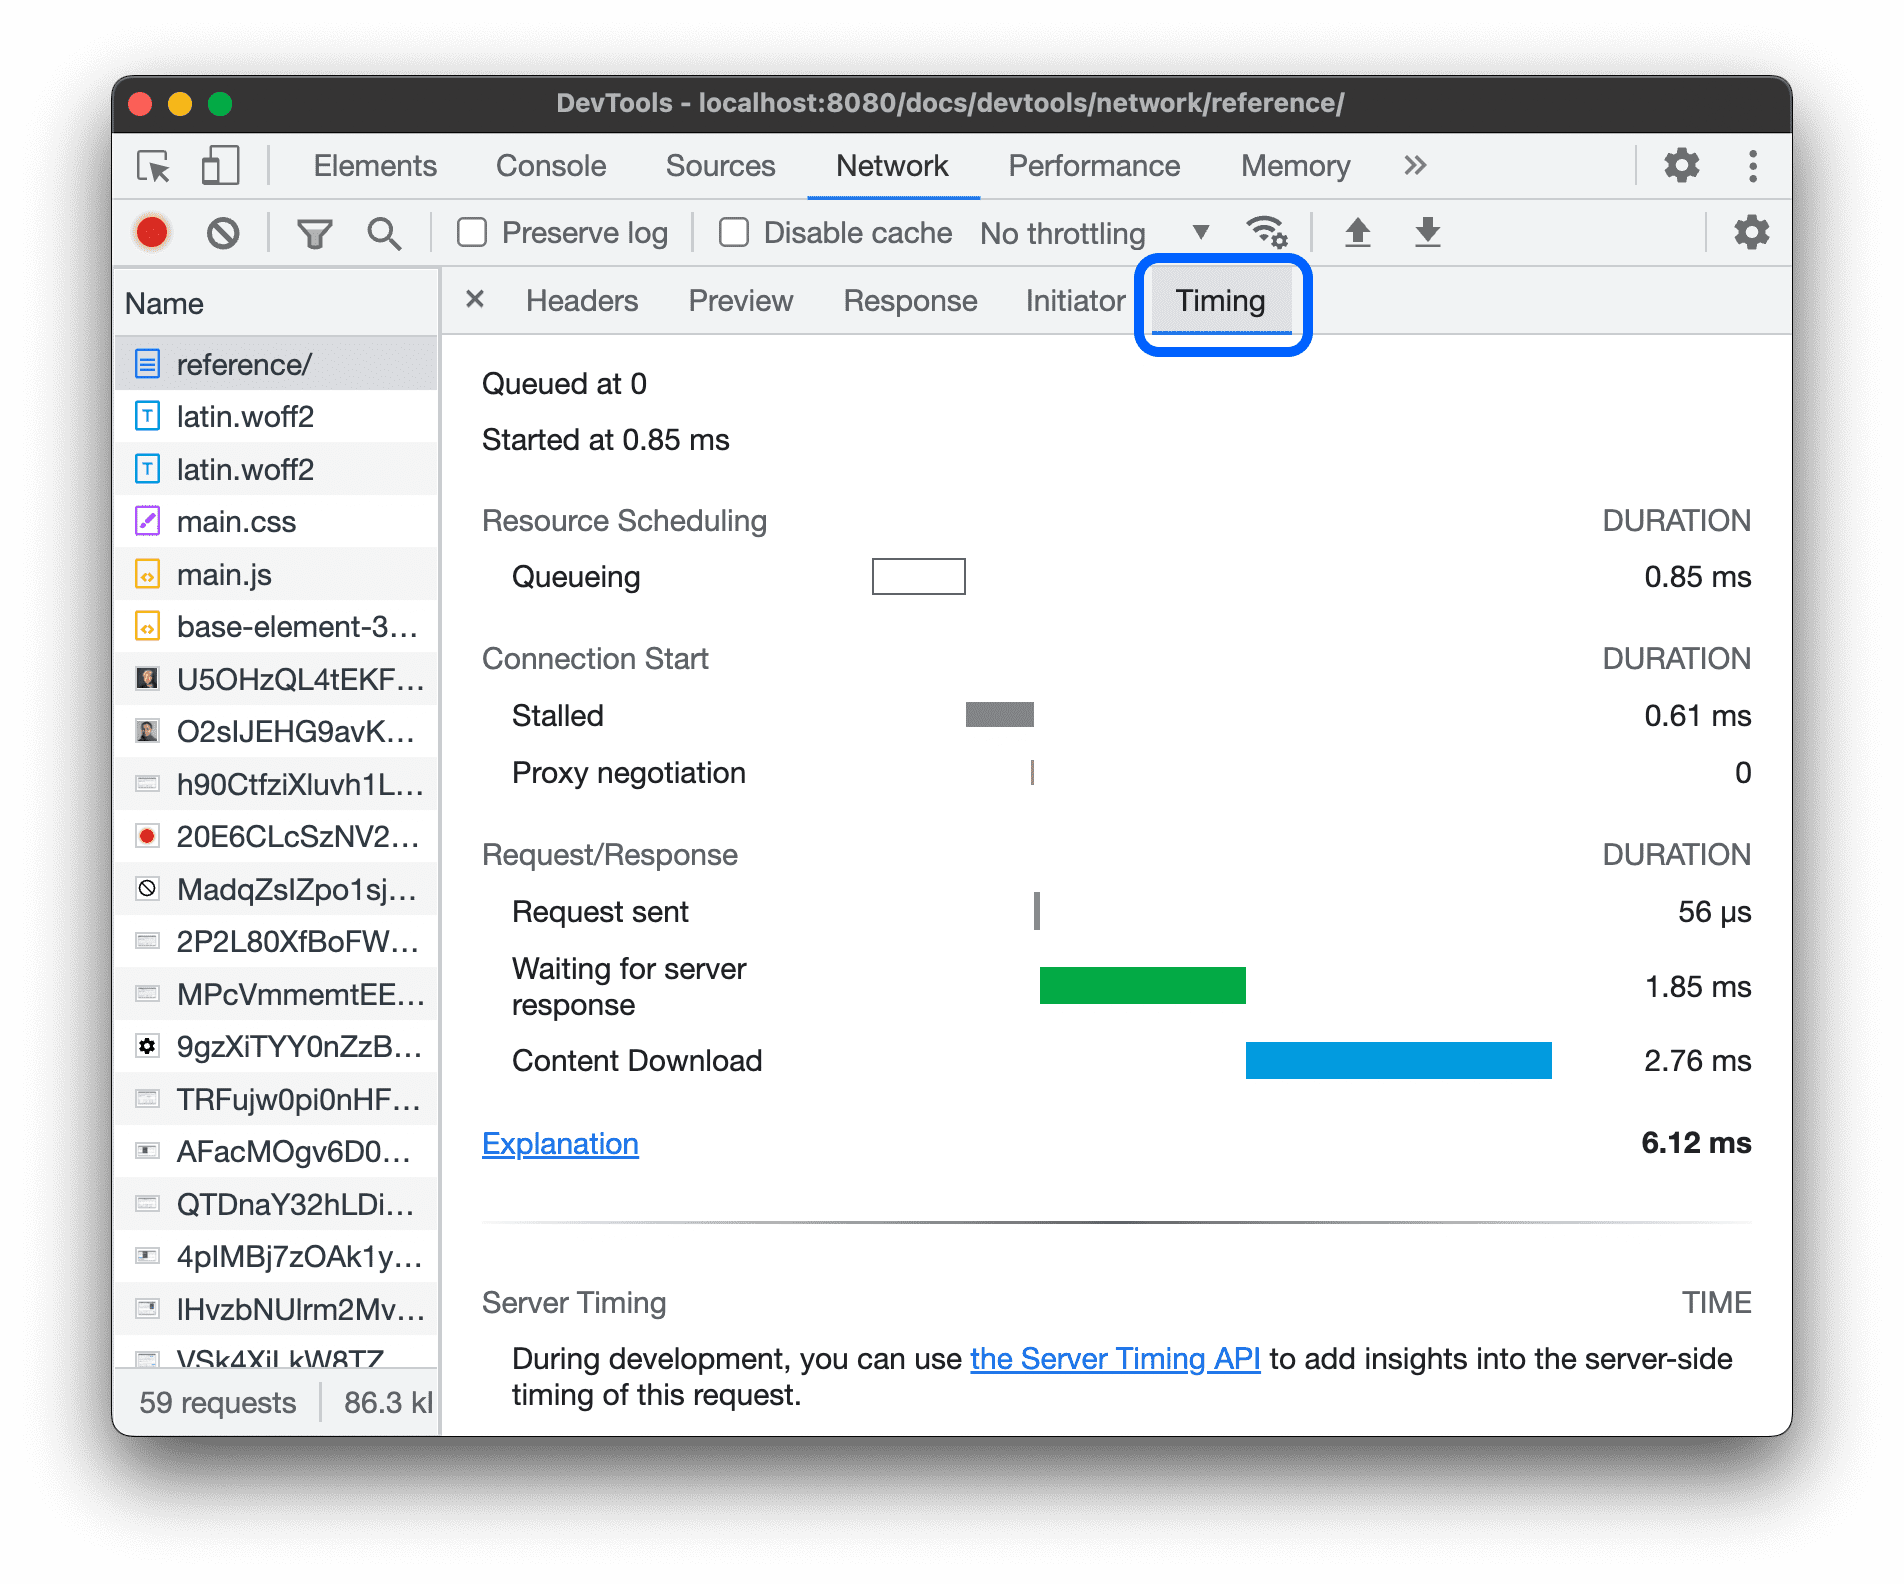
Request timing. Click a request, go to the Timing tab. Shows DNS lookup, TCP connection, TLS negotiation, time to first byte, and content download. The waterfall chart shows all of these visually for every request.
Copy as cURL. Right-click any request, Copy > Copy as cURL. Paste it in your terminal to replay the exact same request with all headers and cookies. Copy as fetch does the same for JavaScript.
Block requests. Right-click a request, “Block request URL” or “Block request domain.” The page will behave as if that resource doesn’t exist. Good for testing graceful degradation.
Replay a request. Right-click a request, “Replay XHR.” Sends the exact same request again.
See WebSocket messages. Click a WebSocket connection in the Network panel, go to the Messages tab. Shows every frame sent and received.
Export HAR. The download icon exports all network activity as a HAR file. You can share it or import it later for analysis.
Performance
Record. Performance panel, click record, interact with the page, stop recording. You get a flame chart showing exactly what the browser did: script evaluation, layout, paint, composite.
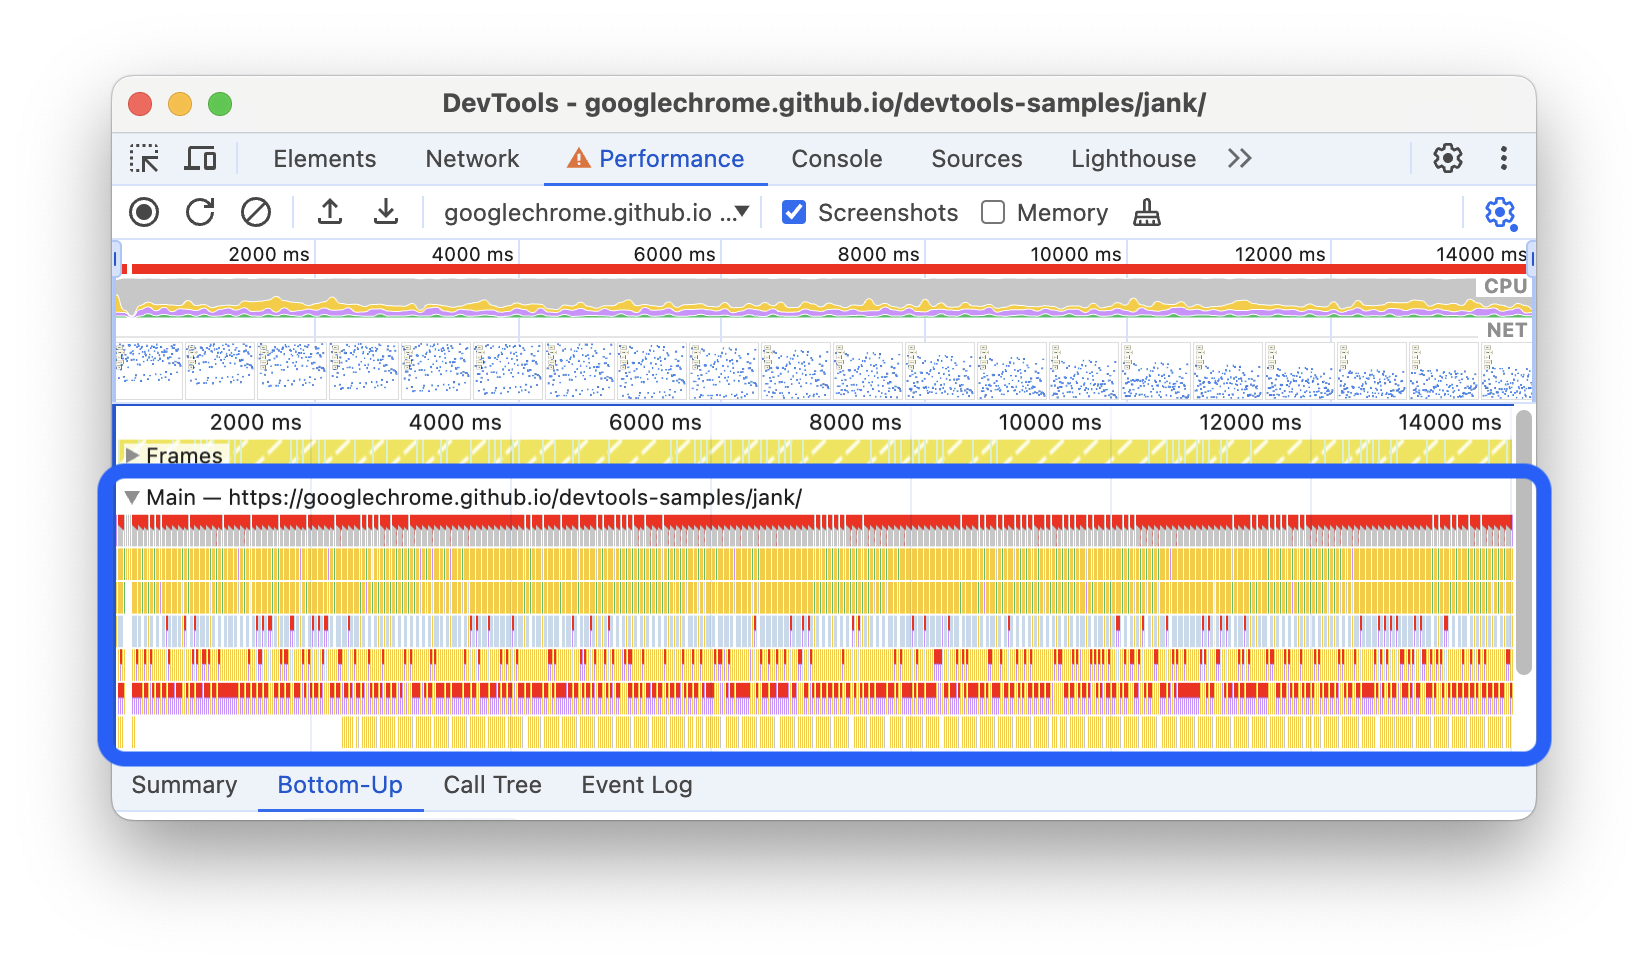
Find layout thrashing. Look for purple “Layout” bars in the flame chart. Click one to see the call stack that caused it. Common causes: reading offsetHeight or getBoundingClientRect then changing styles in a loop.
Paint flashing. Cmd + Shift + P, type “Show Rendering”, check “Paint flashing.” Green highlights appear wherever the browser repaints. Useful for catching unnecessary repaints.
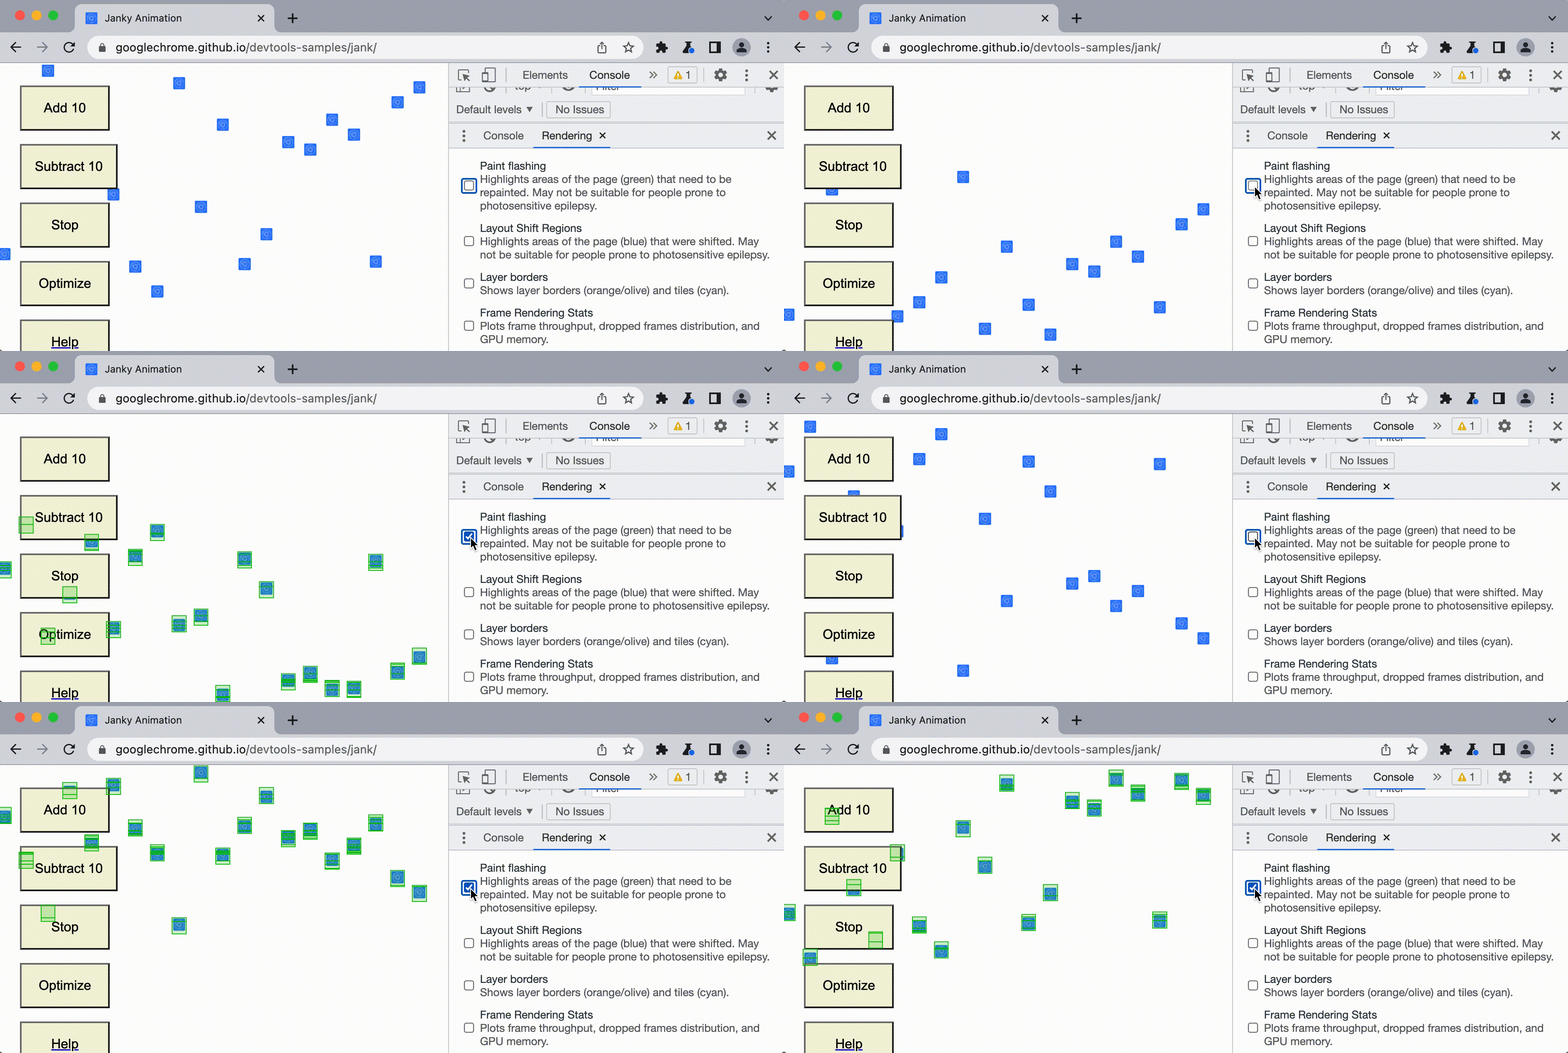
Layout shift regions. In the same Rendering drawer, check “Layout Shift Regions.” Blue highlights show elements that shifted position, which directly causes CLS (Cumulative Layout Shift) problems.
FPS meter. Cmd + Shift + P, type “Show FPS.” Gives you a real-time frames-per-second overlay.
Web Vitals. The Performance panel has a Web Vitals lane that shows LCP, FID, and CLS events during the recording. Or run a Lighthouse audit for a full report.
CPU throttling. The Performance panel has a CPU throttle dropdown (4x slowdown, 6x slowdown). Simulates a slower device.
Hidden Power Tools
Snippets. Sources panel > Snippets tab. Write JavaScript, save it, run it with Cmd + Enter. Snippets persist across sessions. I keep a few for common debugging routines: clearing storage, logging all event listeners, dumping performance marks.
Local overrides. Sources panel > Overrides tab. Select a local folder, then edit any file in Sources. Your changes save locally and load instead of the server version on refresh. You can patch a production site without deploying.
Workspaces. Sources panel > Filesystem tab. Add your project folder and DevTools links files to your local source. CSS changes in the Styles panel save directly to your .css files. Persistent live editing.
monitor(fn) and debug(fn). monitor(fn) logs calls. debug(fn) sets a breakpoint on the first line of the function. Both only work in the console.
Override response headers. Network panel > right-click a request > “Override headers.” Lets you test how your page reacts to different CORS headers, cache policies, etc. without changing the server.